Perspectives Report
Laurie McCabe and Sanjeev Aggarwal
Sponsored by: IBM
Introduction
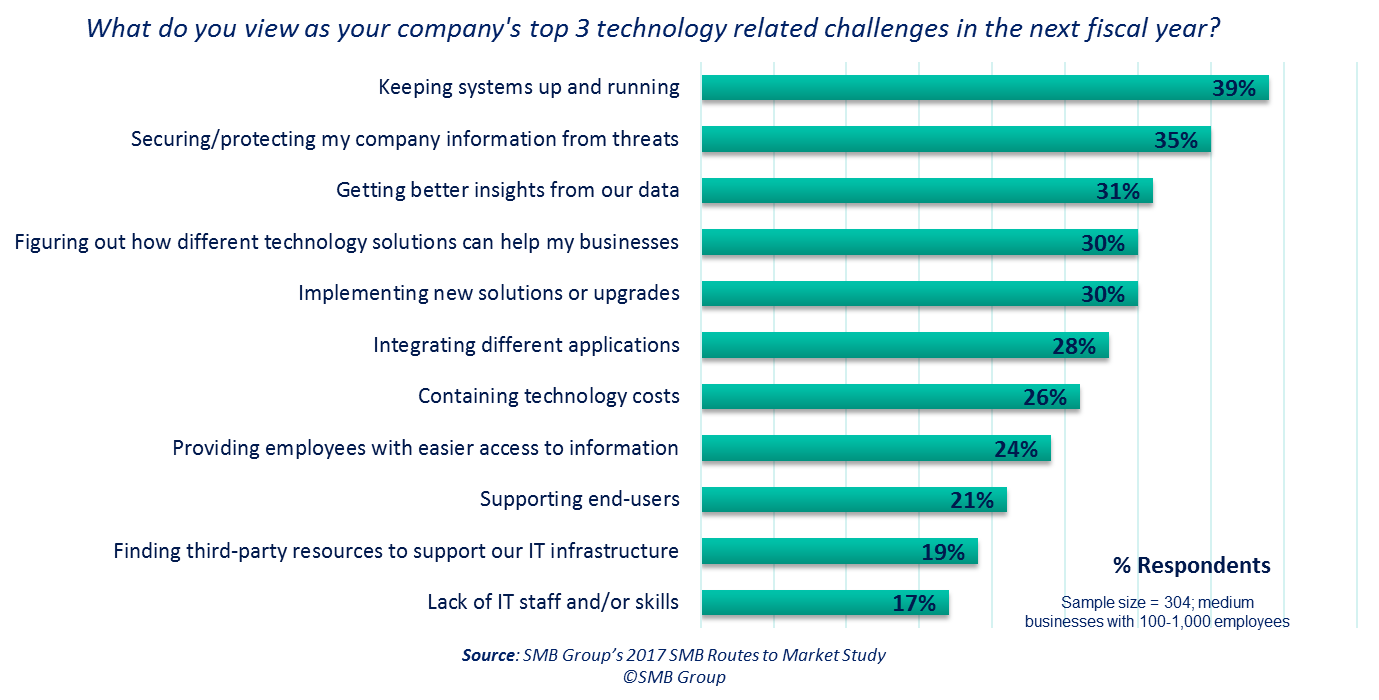
Businesses have always needed the ability to track and measure critical success metrics in a quantifiable way. Yet this is often a tall order for midsize businesses (100 to 1,000 employees) to address. The problem is that when there’s too much information, people find it difficult to fully comprehend it and make informed decisions. In fact, in our 2017 SMB Routes to Market Study, midsize businesses indicated that “getting better insights from the data we already have” as one of their top technology challenges.
Figure 1: U.S. Midsize Business Top Technology Challenges
We live in an age where technology is transforming virtually every industry. As a result, midsize business decision-makers face added pressure to “read the tea leaves” to reduce uncertainty. In this shifting business environment, simply analyzing past performance is no longer enough. You also need predictive capabilities to anticipate trends so they can plan for what’s likely to happen in the future.
A new generation of powerful, yet cost-effective and easy-to-use cloud-based analytics solutions can help level the analytics playing field for midsize businesses. The solutions offer the insights you need to answer key business decisions, such as “Who are my best customers?” or “How can we better match market demand with product supply?” or “How can I recruit and retain employees with the skills the business needs?” Armed with the right insights, you can better assess how they are doing today, and plan for what they should be doing in the future to optimize business performance.
This means that now is a great time for you to rethink your approach to business intelligence and analytics. In this paper, we examine why businesses should start using modern, predictive analytics solutions, and how they can help your business stay on ahead of new trends, opportunities and market shifts.
Dealing With the Data Rush
“Big data” is a big buzzword in the IT industry—and for good reason. According to IDC, 1.7MB of new information is being created for every human on the planet, every second of every day, and 180 zettabytes of digital data will be generated worldwide by 2025.
While zettabyes may be hard to wrap your head around, just consider all of the different types of information that’s moved from physical to digital form over the last several years:
- Doctors have moved from paper charts to electronic medical records.
- Merchants have moved from paper credit card imprinters to POS terminals to virtual terminals to mobile payment devices.
- Internet of Things (IoT) technology is equipping objects—from Fitbits to traffic sensors to seismographs—to record, report and receive data, and create entirely new digital data streams.
- People are growing their digital footprints on a myriad of social networks, and via their interactions with the companies they do business with.
Figure 2: U.S. Medium Business Attitudes About Decision-Making and Use of Analytics Solutions
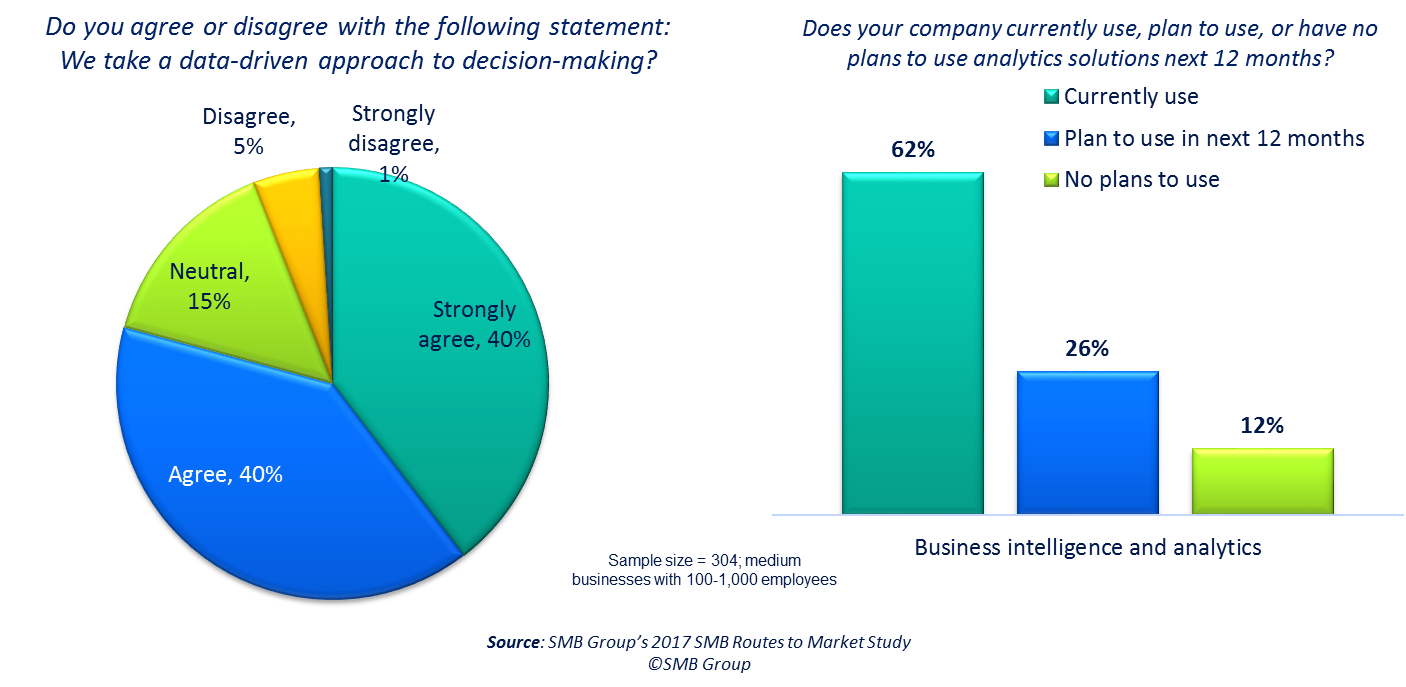
Although 62% say they currently use an analytics solution to support this data-driven approach, many midsize businesses rely primarily on spreadsheets or homegrown tools for data analysis: In SMB Group surveys, spreadsheets are the most frequently used analytics tool among midsize companies. Because they don’t often have data scientists on staff, many feel that moving from basic tools that analyze internal, transactional data to a more comprehensive analytics approach is out of reach.
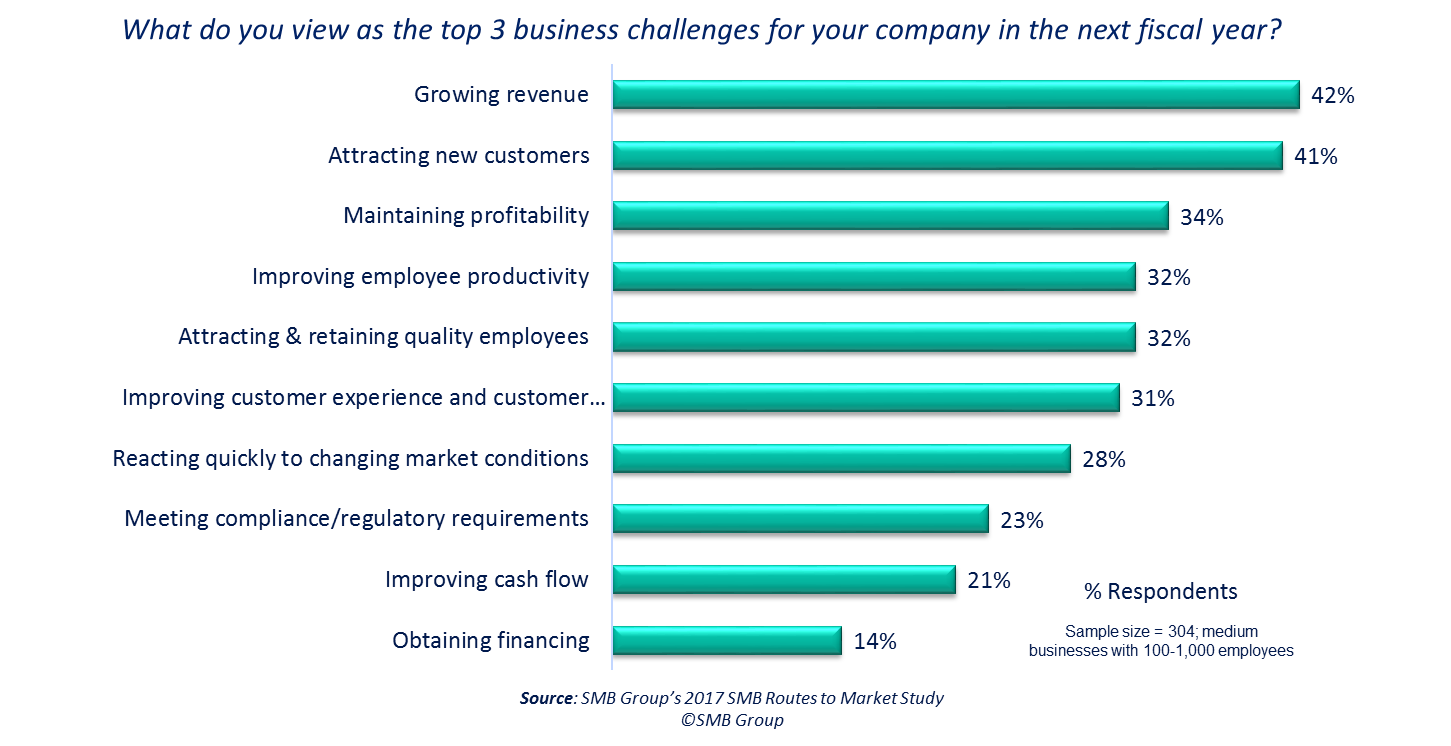
Figure 3: U.S. Midsize Business Top Business Challenges
The Limitations of Spreadsheets
As Albert Einstein noted, “Information is not knowledge.” Midsize businesses may have plenty of data, but if they’re using spreadsheets, they will reach a tipping point where they lack the means to extract knowledge and insight from it. In fact, many midsize businesses struggle to get the information they need to meet the wide range of complex business challenges (Figure 3) on their plates.
This is because as powerful as spreadsheets are, they have limitations that can lead to inefficiencies and expose the business to potentially damaging risks, such as inaccurate calculations and security breaches. When spreadsheet analysis is the norm, it’s also likely that everyone is crunching their own data–which can results in conflicts about what’s the “right” version of the truth.
In addition, spreadsheets must accommodate the increasing volumes of digital information that are being created every day. But as spreadsheets grow, they also get slower. It takes more time to run queries, and links and formulas are more likely to break.
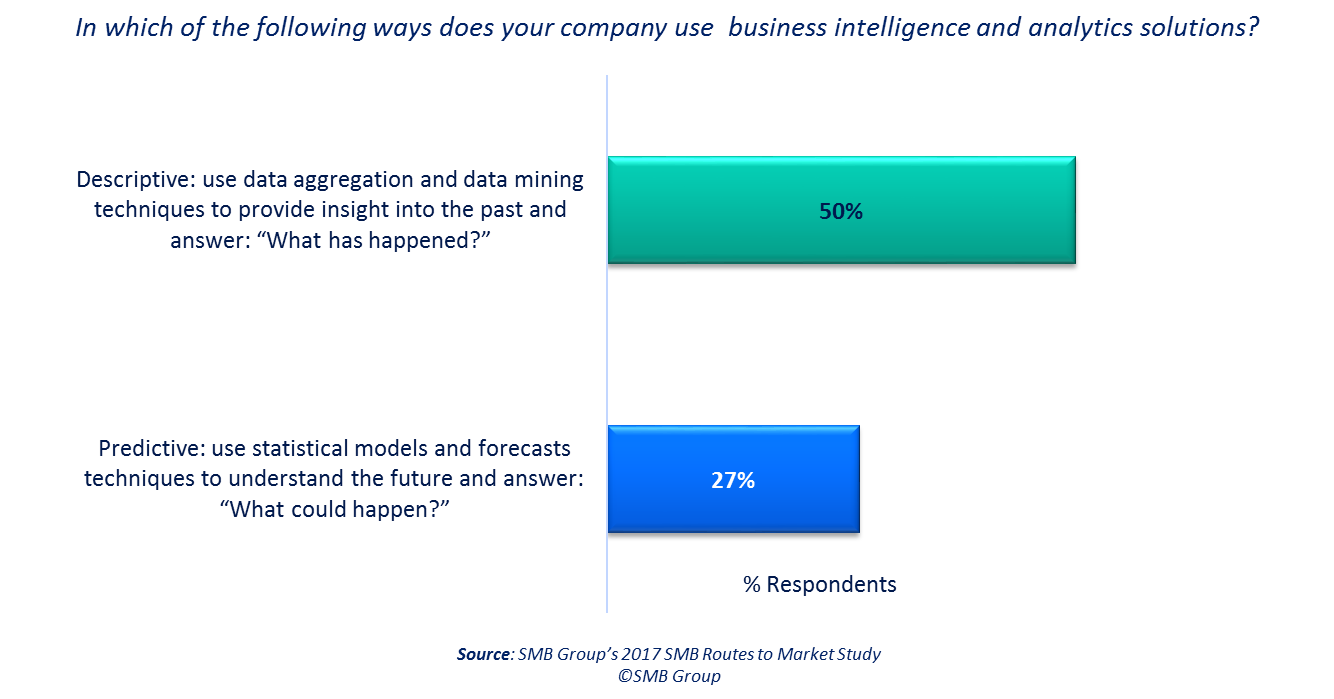
Finally, spreadsheet analysis is typically limited to providing information to tell you about what’s already happened–limiting most midsize businesses to using analytics for descriptive purposes only (Figure 4). This stops short of answering predictive questions that can you evaluate what could happen in the future, or providing insights about possible outcomes so you can determine the best course of action for a given situation.
Figure 4: Ways in Which U.S. Midsize Businesses Use Analytics
Advancing Your Business with Predictive Insight
But new technology is advancing at warp speed in the analytics space. Vendors are building powerful, yet easy to use solutions that help midsize businesses gain the benefits of predictive insights so they can stay ahead of market and competitive trends.
These solutions use database technologies that can deal with both structured data, such as transactional data from orders or payments, as well as unstructured data, such as emails. They can pull in and analyze both internal data, as well as data from external sources, such as social media. They also use technologies to speed data processing, number crunching and analytics to deliver analysis more quickly to decision-makers.
Modern predictive analytics solutions are also easier to “layer” on top existing data than in the past. As important, they are often designed for business users, offering capabilities such as:
- User-friendly interfaces, with guided discovery to make it easier to ask the questions that will lead to “aha” moments and insights.
- Visualization tools that turn rows of data into visuals that represent what the data says in intuitive ways that makes it easier to communicate the story the data is telling.
- Natural language capabilities so users can easily query the data.
Some vendors provide pre-packaged applications that integrate all of the components necessary for analytics solution, including connectors to business solutions; the data model; tools to extract, transform and load (ETL) data; a semantic layer; query and reporting capabilities; and predefined metrics, reports and dashboards. Many solutions offer free-trials, and are available as subscription-based services. This takes the friction out of the buying process, and makes using analytics solutions much more affordable.
For instance, IBM offers a free trial for SPSS Statistics and a Subscription payment model of $99/month, without any term commitments, from the IBM Marketplace.
The self-service offering is easy enough for business users to learn to use, while also providing advanced capabilities that data scientists expect. From one online interface, users can subscribe to and download SPSS Statistics Service, which will help you to:
- Improve business decision-making processes and business outcomes by quickly gaining insights from data sets in any format, including spreadsheets.
- Eliminate labor-intensive manual checks with advanced data preparation capabilities.
- Monetize the data you own by analyzing trends, forecasting, and planning to validate assumptions and drive accurate conclusions.
Users can input and aggregate data from multiple sources–whether from spreadsheets, email, call center notes, transactional data, sensors, social media or other inputs. Once the data is aggregated, decision-makers can get a clearer view of the business and the market, and get everyone on the same page to enable more efficient and effective decision-making.
With these capabilities, you can start thinking about moving beyond descriptive analysis, which provides insight into the past to answer, “What has happened?” to predictive analytics, which use statistical models and forecasts techniques to understand the future and to answer, “What could happen?”
For instance, you can use predictive analytics to anticipate customer behavior and purchasing patterns, predict sales profitability trends, or forecast inventory demand, such as:
- Who are my best customers?
- How can I reduce customer churn?
- Where should I open a new store or facility?
- How is a new competitor affecting my business?
- How can I improve employee engagement and performance?
As a result, you’ll be able to more readily identify and act on opportunities for cost savings, efficiencies and new business opportunities. Because SPSS Statistics Service is subscription-based, businesses can adjust resources up or down as needed for peak decision-making times, such as during the holiday season for retailers.
Smoothing the Shift
Although analytics solutions have gotten easier to access, use and gain insights from, Inertia and the tendency to stick with “the devil you know” prevent many businesses from moving from spreadsheets to more capable analytics solutions. In most cases, key stakeholders must be on board to help spearhead this shift.
One of the best selling points for this transition is that many studies show that businesses that can effectively harness and use data can gain dramatic market advantages over those that don’t: SMB Group’s 2017 SMB Routes to Market Study shows that midsize businesses that use “purpose-built” analytics solutions are 80% more likely to expect revenues to rise than those that rely on spreadsheets for business analytics.
Often, a good way to get started down a successful path is to cherry pick your first use case. Determine the most obvious missing information links, and at those where having better insights would yield the most immediate value. You should also identify areas where spreadsheet use is heaviest, as this may indicate that people looking for better business decision support and may be more willing to try new tools. Choose a place where you can quickly demonstrate the value, and build from there.
The best place to start will differ for every firm, but here are some pain points questions to think about in different functional areas to get started:
- Sales and marketing: Is the organization more reactive than pro-active in addressing critical situations such as declining pipeline, increase customer churn, lowering conversion rates. Do you lack visibility into sales and marketing activities and effectiveness? Does a lack of visibility into customers’ buying trends undermine your ability to up-sell and cross-sell?
- Finance: Does it take too long to close the books? Is it difficult to measure actuals against targets? Is it challenging to analyze large volumes of data? Is the budgeting process complex, inefficient and lengthy? Do you spend too much time producing reports for others in the organization?
- Operations, manufacturing and customer service: Does the team lack visibility into overall performance of the supply chain, preventing them from taking timely corrective action? Is it difficult and complex to adjust to shifting customer needs and demands? Is there information disconnect with other departments, such as sales and marketing?
Across business functions, predictive analytics provides insights to help you solve these problems by answering three critical questions:
- How are we doing?
- What is driving our current performance?
- What should we do to improve results?
As a result, managers can make better, faster decisions to drive growth, reduce costs and create better business outcomes.
Summary and Perspective
While decision-makers must do their homework to determine which analytics solutions will be the best fit for their businesses, the advantages of fact-based decision-making cannot be underestimated.
At a time when the business environment is undergoing rapid transformation, and information is proliferating at an unprecedented rate, midsize businesses need an intelligence edge that spreadsheets can’t provide. Being able to easily access, understand, analyze, report and act on critical information will increasingly become a make or break factor for business success.
Predictive analytics solutions can provide midsize companies with insights needed to spot new opportunities, avoid mistakes and identify small problems before they mushroom into big ones–and stay ahead of market trends and the competition.
© SMB Group, 2017
SMB Group focuses exclusively on researching and analyzing the highly fragmented “SMB market”—which is composed of many smaller, more discrete markets. Within the SMB market, SMB Group’s areas of focus include Emerging Technologies, Cloud Computing, Managed Services, Business and Marketing Applications, Collaboration and Social Media Solutions, IT Infrastructure Management and Services, IoT and Green IT. Read our 2017 Top 10 SMB Technology Trends for our views on game-changers in these and other areas of the SMB market.